On May 9, our Directed Undergraduate Research class had the opportunity to workshop our mapping projects with Dr. Lincoln Mullen, a spatial historian and professor at George Mason University. He gave us useful feedback about our individual work, but also helped us think about how digital maps can or should work in general. For example, we brainstormed about the different “categories” that our maps could fall under, depending on which aspects we prioritize. Some of these category distinctions include:
- Qualitative Maps (that tell a story or display lots of media) vs Quantitative Maps (that visualize large amounts of data)
- On the surface, most of our maps seem to be more qualitative than quantitative. Dr. Mullen offered some suggestions as to how we can be more analytical with the quantitative data that we do have. For example, displaying varied versions of the map in a “small multiple” can
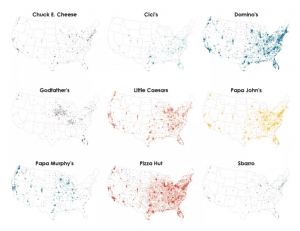
Dr. Mullen showed us this example 1 of a small multiple, in which data is grouped into different categories and visualized accordingly
visually display how grouping data according to different categories can change the map results.
- On the surface, most of our maps seem to be more qualitative than quantitative. Dr. Mullen offered some suggestions as to how we can be more analytical with the quantitative data that we do have. For example, displaying varied versions of the map in a “small multiple” can
- Time-Sensitive/Diachronic vs Static/Synchronic
- Comparative vs Single-Focus
- Deep Mapping vs a more narrow approach
Thinking about what these categories entail and why or why not we choose specific attributes can help us become more clear and purposeful in our map-making endeavors.
Dr. Mullen’s workshop also gave us the opportunity to consider aspects of our project beyond the maps themselves. We discussed the importance of mobile access to the website and the maps, and of sharing our data: after all, the maps are “visual extensions” of the data, which is at the central core. Additionally, sharing our data could help make possible much larger projects- the kind that are too big for any one individual to compile data on. Even if we think our data sets aren’t much to write home about on their own, they can be combined and compared with any number of other data sets, and then we have the chance at gaining real insight.
You must be logged in to post a comment.