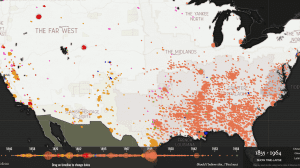
Named after the work of Monroe Nathan Work, this project maps every known lynching in American history carried out by a mob. Each marker on the map represents one incident, and each color represents a different racial/ethnic demographic. The map is accompanied by a timeline that ranges from the first known lynching in 1835 to 1964. You can easily drag over the timeline to change the range of dates presented in the map. The map of the U.S. itself is presented in generalized regions like “the Deep South” and “the Far West” for historical context. One especially unique feature of this map is the way that the bibliography is linked – for each data point, the source cited can be accessed on the website after one click.
Recent Posts
- Reconstructing the t(Ruth): A Biography of Ruth Weatherless
- When Life Gives You Lemons: A Reconstructed Biography of John Cleveland Lemons
- Out of the Field, Into the Rabbit Hole: From Florence Price to Jewel Jennifer – Part II
- Out of the Field, into the Rabbit Hole: From Florence Price to Jewel Jennifer – Part I
- Gladys C. Fearing
Tags
Aaron Copland
advice
Americans in Paris
archival research
Ballets Russes
Burleigh
challenges in mapping
Cinema
creating maps
Darius Milhaud
data
data entry
Diaghilev
diana sinton
digital humanities
digital maps
DUR
final reflections
First Blog Post
Goals
Google Maps
H.T. Burleigh
Harmony Bench
Harry T Burleigh
HT Burleigh
Introduction
Jazz
Josephine Baker
Le Gaulois
Map
mapping
methodology
negrophilia
Opéra
Paris
Princesse de Polignac
race
Reflection
Research
research methods
research process
Research Project
Resources
Slave Songs of the United States
Spreadsheet
You must be logged in to post a comment.