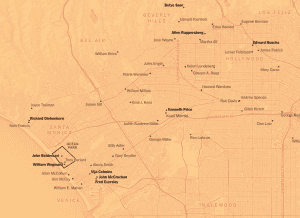
From 1932 to 1975, Annuals and Biennials held by the Whitney Museum of American Art recorded the street addresses of artists whose works were showcased. In 2019, the New York Times used this data to publish a series of static and maps, accompanied by prose, that shows geographically situated hot spots of artistic networks, power, and money across the U.S. Each map covers one of three major U.S. cities (New York City, Chicago, and Los Angeles), and is accompanied by a of its corresponding region. The NY Times also uses this project to discuss the change in the Biennial’s racial, geographic, and gender diversity.
Recent Posts
- Reconstructing the t(Ruth): A Biography of Ruth Weatherless
- When Life Gives You Lemons: A Reconstructed Biography of John Cleveland Lemons
- Out of the Field, Into the Rabbit Hole: From Florence Price to Jewel Jennifer – Part II
- Out of the Field, into the Rabbit Hole: From Florence Price to Jewel Jennifer – Part I
- Gladys C. Fearing
Tags
Aaron Copland
advice
Americans in Paris
archival research
Ballets Russes
Burleigh
challenges in mapping
Cinema
creating maps
Darius Milhaud
data
data entry
Diaghilev
diana sinton
digital humanities
digital maps
DUR
final reflections
First Blog Post
Goals
Google Maps
H.T. Burleigh
Harmony Bench
Harry T Burleigh
HT Burleigh
Introduction
Jazz
Josephine Baker
Le Gaulois
Map
mapping
methodology
negrophilia
Opéra
Paris
Princesse de Polignac
race
Reflection
Research
research methods
research process
Research Project
Resources
Slave Songs of the United States
Spreadsheet
You must be logged in to post a comment.