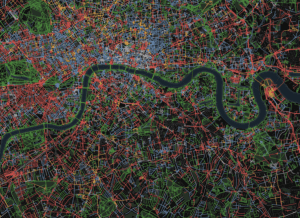
In maps made with Carto, MapBox, and OSM, researchers from Bell labs have created a Maps for the streets of the World’s major cities, and analyzed what kinds of noise are on that street (music, transportation, nature, etc). They have also included a chart of the emotions of each street – from happy to aniticipatory to angry and several emotions in between. To do this, they use sound clips and pictures from those places and create statistically “happy, musical” streets, or, in comparison, “angry transportation” streets. Their site is fairly easy to navigate and very organized, and their sources and publications are easy to find as well. While the site is accessible, you can’t zoom out at all and must pan the streets to see real change, rather than zooming out and being able to see it all at once. Looking into the “sensorial and emotional layers of cities” seems like something we could look into incorporating into our own maps. Since our maps are about history, and not the present with current technology, it would be difficult for us to gauge how happy a street would have been just through a picture or two, or even none at all.
You must be logged in to post a comment.