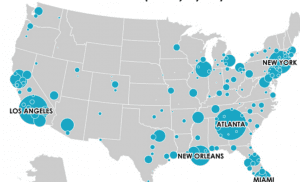
Richard Florida of the University of Toronto discusses the research that he and his team led to answer the question What does the geography of popular music look like? To do this, he and his team collected information from MySpace in 2007, to identify ten, specific popular genres and the number of plays or views each specific genre received. The proportional point maps portray the relative popularity of the specific musical genres in different general areas of the United States, causing the maps to be vague in terms of specific geographic locations. While visually engaging, the maps prevent access to the underlying data, prohibiting detailed data analysis.
Recent Posts
- Reconstructing the t(Ruth): A Biography of Ruth Weatherless
- When Life Gives You Lemons: A Reconstructed Biography of John Cleveland Lemons
- Out of the Field, Into the Rabbit Hole: From Florence Price to Jewel Jennifer – Part II
- Out of the Field, into the Rabbit Hole: From Florence Price to Jewel Jennifer – Part I
- Gladys C. Fearing
Tags
Aaron Copland
advice
Americans in Paris
archival research
Ballets Russes
Burleigh
challenges in mapping
Cinema
creating maps
Darius Milhaud
data
data entry
Diaghilev
diana sinton
digital humanities
digital maps
DUR
final reflections
First Blog Post
Goals
Google Maps
H.T. Burleigh
Harmony Bench
Harry T Burleigh
HT Burleigh
Introduction
Jazz
Josephine Baker
Le Gaulois
Map
mapping
methodology
negrophilia
Opéra
Paris
Princesse de Polignac
race
Reflection
Research
research methods
research process
Research Project
Resources
Slave Songs of the United States
Spreadsheet
You must be logged in to post a comment.