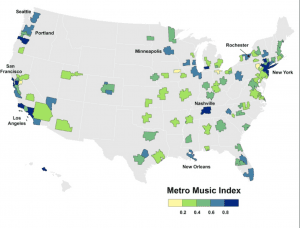
This static map shows one way to answer the question “where are America’s leading centers for musicians and the music industry?” Charlotta Mellander of Martin Property Institute combined data on musicians and recording industry business establishments via the Bureau of Labor Statistics and the U.S. Bureau of Economic Analysis, to create a Metro Music Index. This index provided map-able data ready for visualization. The higher the density, the higher the music index number, and darker the area on the map. As Richard Florida explains, this map not only shows density through clusters, but can provoke more questions about the influences and environments that made those clusters possible.
You must be logged in to post a comment.