Every song collected has a story.
Consider where it came from – perhaps a 12th c Scottish farmboy hummed a song to himself that later was heard in a field in Kentucky, passed down from plantation owner to slave.
Consider who sang it – was it a child, unaware of hidden meanings in the text? Was it an adult who wrote the words based on their heartaches?
Consider when it was sung – was it sung at a funeral? A wedding or other joyous occasion? Was it sung by a young man working his day away, paid very little but unable to do anything about it?
Consider why it was sung – maybe someone heard that a Library of Congress song collector, John Lomax, was in town and recording songs that would represent their space and place in time forever in the archives in the nation’s capitol. Would they have recorded it for personal fame and the hope of widespread recognition? Did they record for fun? Did they withhold personal songs that they didn’t want to share with the world?
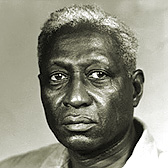
How do we show the music of Vera Hall, Huddie Ledbetter, Henry Truvillion, and others without showing their faces? Consider this blog post so far. I’ve not included audio or video, and so your perception of what I’m telling you is vague at best. Now, look at the images below, interact with the audio clips, and consider how they intersect.
 Vera Hall, friend of John Lomax and recorder of dozens of songs for him on his field recording trips.

 Huddie Ledbetter and his wife. Ledbetter, well known as “Leadbelly,” was one of Lomax’s most infamous “finds” on his recording trips.
These images, videos, and sound clips offer us something a map point deceptively cannot – specificity. Not geographic specificity, but temporal, cultural, and personal specificity only possible through images, sounds, sights, smells, tastes that we can experience and connect with other information we already know. The picture becomes clearer the more we add to it.
Which songs represent the people of these particular southern times and places? How do we determine that? Each song has specific facts that can be linked to it, but its singer, its creator, its story gives it life and soul. How do we display the soul of a song in a map, digitally, in a way that helps people understand all these explanations and distinctions better, rather than display them in a reductive way that inaccurately represents all the aspects around the songs? How do we map the body and also show the soul?
The truth is, perhaps we can’t. But we can try. We can use words, our “inexhaustible source of magic” (according to J.K. Rowling) to say what a point on a map cannot. We can use images, songs, scans of letters, lyrics, and other information to create “deep maps.”1 Perhaps we cannot make the fantasy of “hypercities” a reality, but we can at least give a little context to the quantitative data we throw in a database and project on a map.2
Adding these features in different mapping platforms is not easy. In ArcGIS, it is possible to add media, but more difficult than in Google Maps or in ArcGIS Storymaps. Google maps allows for a more user-friendly approach, polygon and line making, and moving data points on the map. However, it is more difficult to show a heat map or cluster map, which can show trends in data in a more recognizable way. Since the trends in data are often linked to other aspects of the identities of the performers of this music, it is important to accurately represent trends, where things moved, and where songs weren’t. Audio, video, and photos, along with embedded media of all kinds, are easy to upload into the Map Journal version of ArcGIS Storymaps, and fairly easy to incorporate into Google maps. Since we have established that incorporating these extras is especially important for this research, I believe it is best to stick with Google Maps, ArcGIS heat/cluster maps, and ArcGIS Storymaps to accurately depict this rich music that is inextricably linked to the sound, time, and place.
1 Todd Presner, David Shepard, and Yoh Kawano, Thick Mapping in the Digital Humanities, (Harvard University Press: Cambridge, 2014) 19.
2 David J. Bodenhamer, John Corrigan, and Trevor M. Harris, ed. Deep Maps and Spatial Narratives. Bloomington: Indiana University Press, 2015.