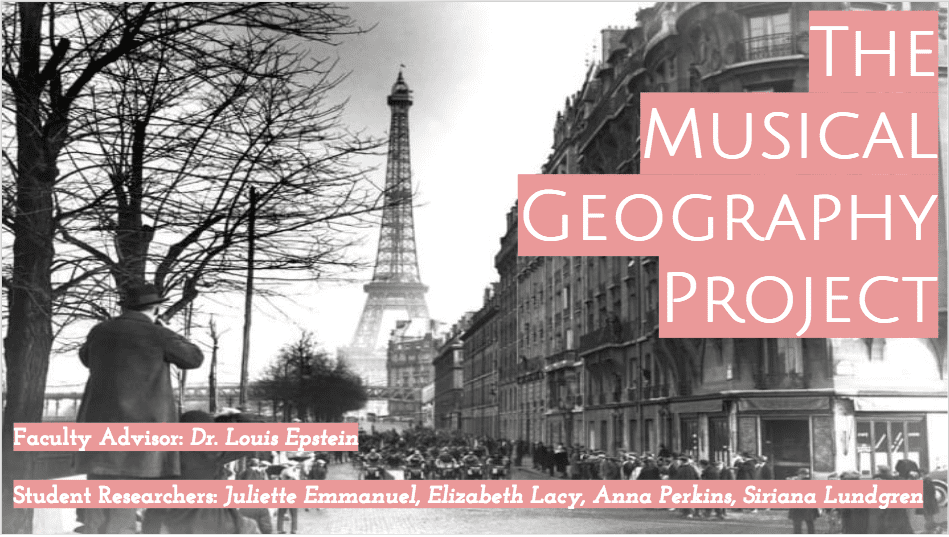
This morning, my research team and I presented our goals for this summer’s iteration of the Musical Geography Project at the CURI Symposium. Now that we’ve had to consolidate our ideas for the project and present them in public, we have a much clearer idea of what we’re up to this summer. I couldn’t resist including the title slide of our presentation (see above), as we spent a considerable amount of time on font, design, and color decisions. I have to say, our attention to aesthetics made ours one of the snazzier presentations (who says academia has to be sad and drab?).
Essentially, our project aims to change the way many of us think about music. Musical geography explores the intersection between space, time, and sound, using maps to convey arguments and inspire new research questions. This summer, we’re building off of the work of the past two summers and focusing on the French composer Darius Milhaud, placing his music in its spatial and temporal context, and using mapping techniques as both a research tool, as well as a way to present our findings. We will be making 4 Milhaud-centered maps: a map of his world travels, a map of the premieres of his works, a map of his music’s critical reception, and a map of the stylistic influences on many of his pieces. Additionally, each of us will be pursuing independent research on a variety of topics that can be investigated spatially. As of now, I have several ideas for independent research that I’ve been exploring, including mapping the influence of Russian and Eastern European folk songs on Stravinsky’s music, mapping the collection of Russian folk music in the 18th and 19th centuries, mapping Soviet ethnomusicological recordings and expeditions, and mapping the spread of Byzantine chant.
Our research methodology is centered around the idea that maps can be used as research tools to make arguments, illuminate previously unseen spatial relationships and patterns, and inspire new research questions. So far, we have used the online mapping platforms Google My Maps and ArcGIS to do this, but may also use Omeka Neatline and CartoDB. To make our maps, we comb through primary sources (such as archived newspapers, letters, and books) and secondary sources (such as biographies) for relevant information, and input that information into spreadsheets. For our composer premieres map, for example, we searched for the premiere date and location for every piece of Stravinsky, Milhaud, Honegger, and Poulenc premiered between 1910 and 1933. Then, we looked up the address of the performance venue (which can require some digging if that venue no longer exists), and found the venue’s latitude-longitude coordinates. All of this information was included in spreadsheets that were uploaded or linked to various mapping platforms.
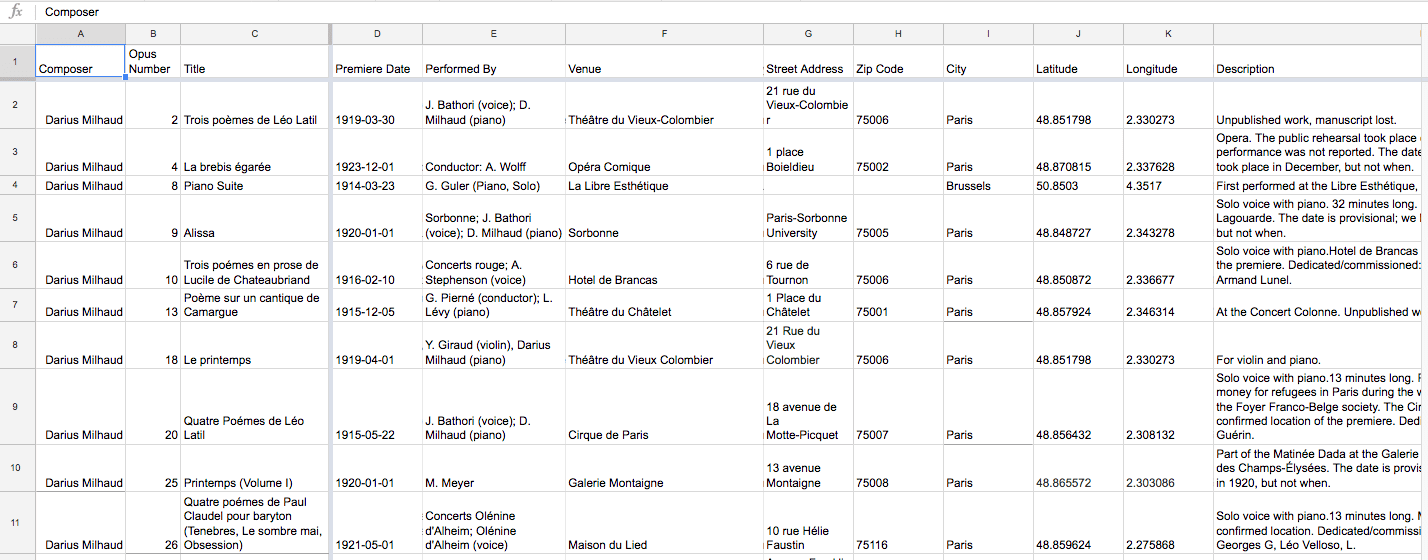
Part of the Milhaud premieres spreadsheet
Most of the work we’ve been doing for the past week has been focused on making this premieres map. After the spreadsheets were complete, we uploaded them into ArcGIS as separate map layers, color coding each data point by composer and adjusting the pop-up windows and data point size for better readability. Not only is this map a great database-like resource, but the spatial relationships made apparent by mapping has already prompted new research questions. Looking at Paris, for example, we might ask, what factors made it possible for so many premieres to happen here, and why are so many performing venues located on the Right Bank of the Seine?
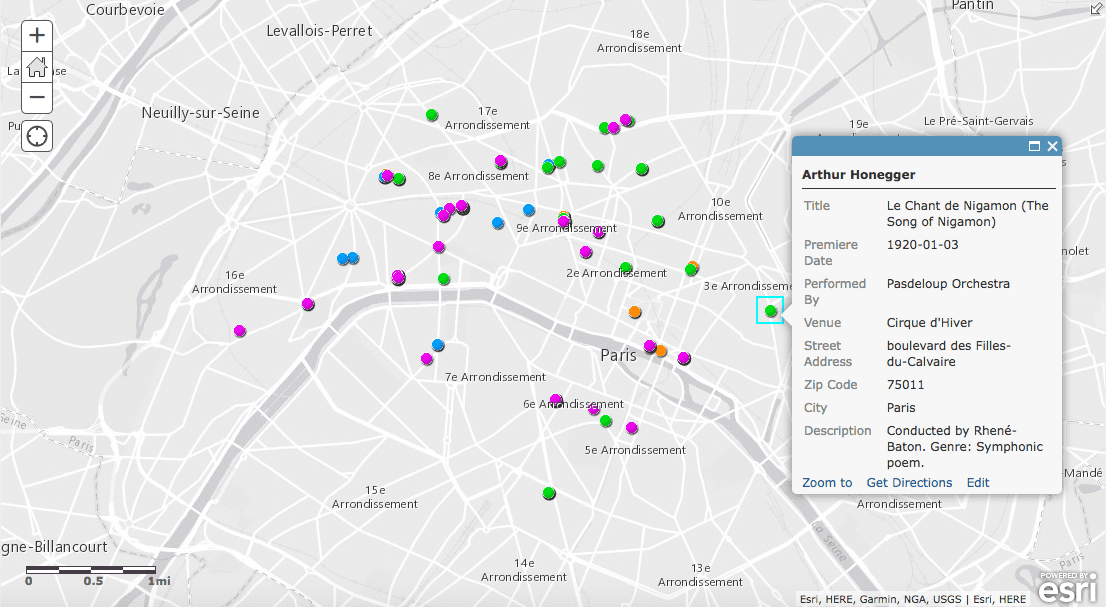
Premieres in Paris, with a pop-up of an Honegger premiere
Zooming out to Europe, we see that Milhaud (in purple) was premiered outside of France more than his French contemporaries Honegger and Poulenc -why was that? Why are there few premieres outside of Paris in France, but many scattered around Germany (not limited to Berlin)?
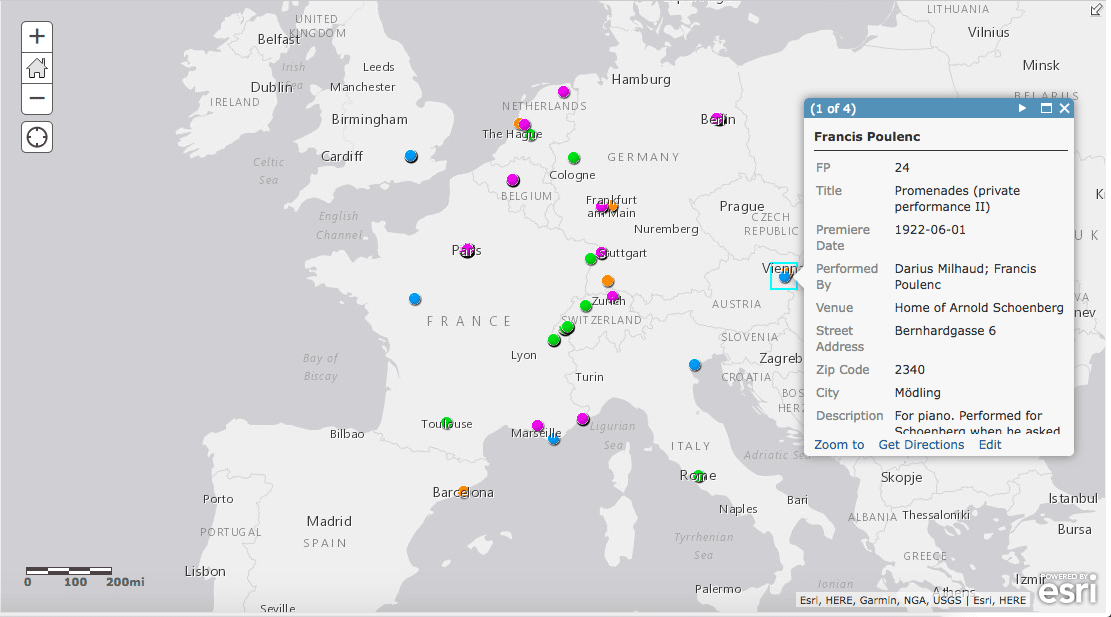
Europe premieres, with a pop-up of a Poulenc premiere
The world-view of this map let’s us see that these premieres were happening on several different continents. Why was that? Who did Milhaud know in Rio de Janeiro, Brazil for his works to be played there? Did this connection influence his subsequent music?
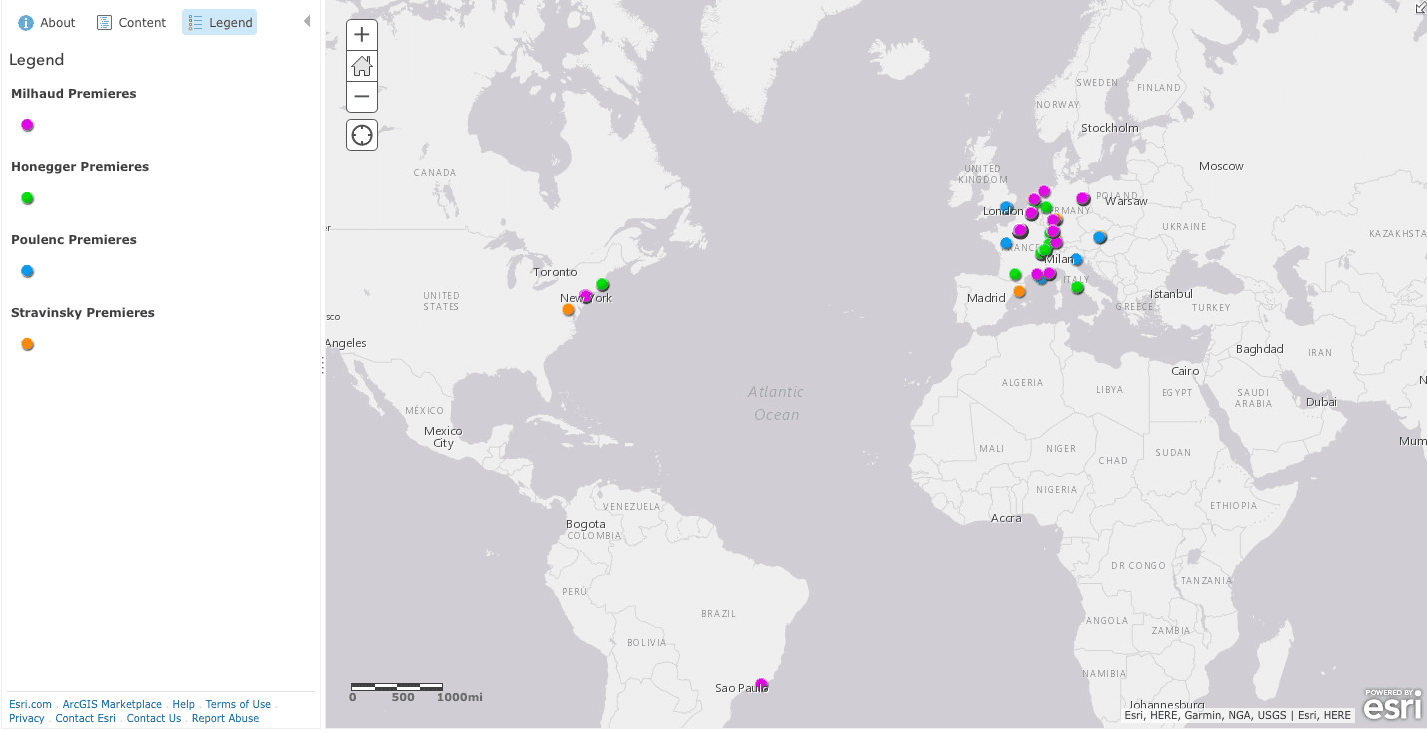
World view of premieres
Our work this summer involves both changing perceptions of music history and contributing to the fields of musicology and digital humanities. We will publish online interactive maps that will make our research findings more accessible and engaging to those outside the academic sphere. Putting Milhaud’s music in its spatial and temporal contexts, our maps will also contribute to the body of scholarship on Milhaud, the interwar period, and the interplay between aesthetics, art, sociopolitical systems, space, and time. Our maps will visualize these relationships and serve as both a pedagogical tool for educators and a resource for scholars. We hope that scholars will be able to not only use our maps as a comprehensive database of Milhaud’s work, but also as a research tool that will generate further avenues of inquiry and questioning.
You must be logged in to post a comment.