It’s amazing how it can take almost two weeks to really develop the goals of a project. I have discovered that it is through active work that we seem do the best learning and growing. I think even after these last weeks of intensive research, we will still be redefining what it is that we are working toward as our research unfolds. Today we gave an initial presentation of our goals at the CURI Symposium. It was extremely helpful in solidifying where we want to go this summer with our project. Here I will summarize what we presented this morning.
The Musical Geography Project explores the intersection of time, space, and sound using mapping technology. In other words, this project seeks to change the way we think about music and music history. It is a new approach to music history that views music not only as something that occurs within history, but as a tool to inform history. Our particular focus this summer will be the life of composer Darius Milhaud. We plan to make four different maps pertaining to his life and work, including, but not limited to: a map of his critical reception, of his style influences, of his premieres, and of his travels around Europe and the world. We will also be pursuing individual projects pertaining to the music in the digital humanities.
Our methodology incorporates elements of both scholarly research and mapping technology. We rely on primary, secondary, and tertiary music historical resources, with a special emphasis on primary sources, where we can find specific concert dates and venues from the 20th Century. We compile the information we find into spreadsheets that we carefully format and standardize to be turned into maps. Using GoogleMaps, ArcGis, and other mapping software, we then are able to visualize our spreadsheets in interactive maps, and tailor them to our scholarly needs.

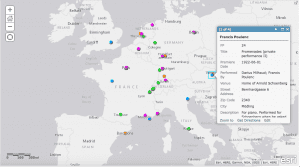
An example of a preliminary composer premieres map we prepared in anticipation of this presentation.
So why does this research matter? First of all, our work has the capacity to change our perceptions of music and of music history. It allows us to put music into its historical and spatial context. This mapping technique also allows us to visualize arguments spatially and temporally. Additionally, putting music history into interactive maps makes it more accessible to those outside the academic sphere, and to those who aren’t familiar with musicology. I think it is safe to say that looking through an interactive map is a little more interesting than reading through a spreadsheet of raw data, or even than reading the biography of a 20th Century composer.
Not only does our project have an impact generally, but it also has many implications within the field of musicology. We are creating a comprehensive database of performances of Milhaud’s music to be used by musicologists as a research tool. Our maps display data in a way that reveals telling patterns and trends in music history. We are also creating maps that scholars and professors alike can use as pedagogical tools. And finally, our research can lead to the discovery of new areas of scholarship within the field. As we have said, maps are not only a way to present research, but they can also lead to new and exciting research questions. Visualizing music history in interactive maps changes the way we think about music, and opens the door to new avenues of learning.
To say that we expect certain outcomes for this project would fail to consider the nature of our work. Using interactive maps in many ways makes this research exploratory more than teleological. However, by no means does the project’s exploratory nature rule out the conclusions and arguments it can lead to. If I have learned one thing in the past couple of weeks, it is that to succeed with a project of this nature, it is often better to simply learn by doing. When in doubt, make a map, and see where it leads you! With this research, we hope to break new ground by exploring what maps can do to illuminate new questions, arguments, and scholarship. Let’s see where our maps take us in the next two months.

You must be logged in to post a comment.