Throughout the course so far, spacial thinking has been an important idea that we engage in our critical process. From analyzing DH models to trying out different GIS platforms, we have been training our brain to perceive questions from a spatially imaginative approach. “How should I reconstruct the historical space?” is probably the most frequent question that I ask myself when I work my own mapping project. Among the various scholarships we encountered and discussions we had in the past two months, Reinhold Strohm’s Music in Late Medieval Bruges and the corresponding activities we had in class have been inspiring in regard to this question.
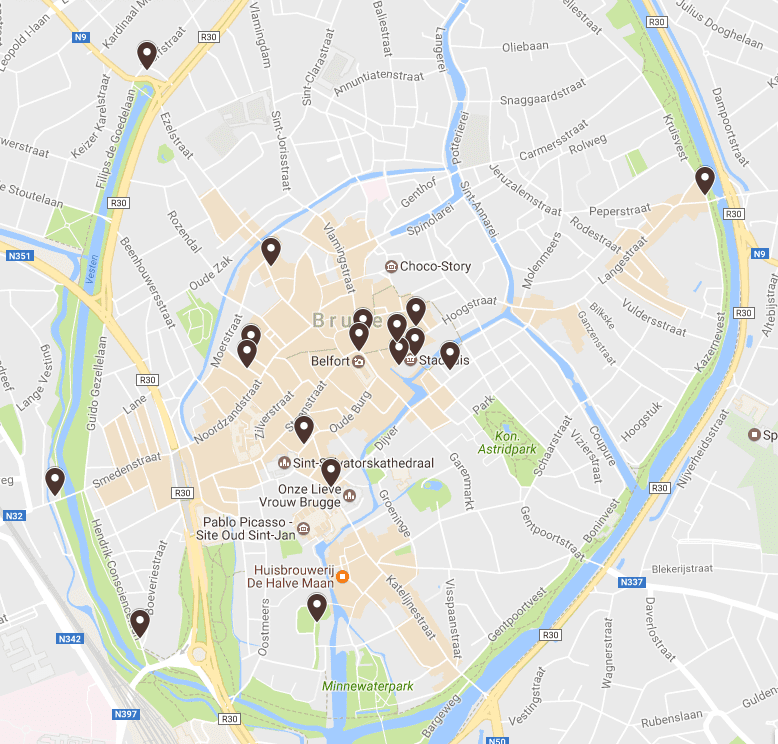
An embryonic form of musical geography, despite of the lack of graphic representation and advanced digital rendering, Strohm’s verbal reconstruction of the late Medieval Bruges represents one possibility of studying music history from a spatial perspective. After doing the assigned reading, our research seminar mapped out the events and locations mentioned in one chapter on Google Map. The entire mapping process was more than revealing to me. What kind of selection we should make of all the available information? How should we organize them? What is the goal of our map: a digital duplication of the imaginative space created by Strohm, or a complete different product using the same source? What do we gain from the digital map that cannot be achieved otherwise? What do we lose? This procedure of mapping, instead of the final product, was the most valuable part of the assignment – to launch the amorphous storage of data onto a visual platform composed of spatial references. From this procedure we gained the spatial references imperceivable in prose, charts, or tables.
On the class day when we shared our research updates, I talked about the challenges and questions that I have been coping with in my own research project. Katharina asked me, “have you visualized it?” This reminded me the effectiveness to have a visualized space in front of the eyes, just like what we did with Strohm’s writing, in order to understand the spatial relation carried in the data. Such visualization can be done in different manners, drawing, google mapping, or other graphical ways. As Prof. Epstein also commented, the final map may not directly say something different from the data sheet, but the mapping process can be very meaningful.
Reference:
Personal conversation with Katharina Biermann and Louis Epstein, [March 28, 2017].
Reinhold Strohm, Music in Late Medieval Bruges (Oxford: Oxford University Press, 1985), 1-9 and 74-101.
You must be logged in to post a comment.